Processes
Sleep
-
class
copernicus.processes.wps_sleep.Sleep[source]¶ sleep Sleep Process (v1.0)
Testing a long running process, in the sleep.This process will sleep for a given delay or 10 seconds if not a valid value.
Parameters: delay (float) – Delay between every update Returns: sleep_output – Sleep Output Return type: string References
MyDiag
-
class
copernicus.processes.wps_mydiag.MyDiag[source]¶ mydiag Simple plot (v2.0.0)
Generates a plot for temperature using ESMValTool. It is a diagnostic used in the ESMValTool tutoriaal doc/toy-diagnostic-tutorial.pdf. The default run uses the following CMIP5 data: project=CMIP5, experiment=historical, ensemble=r1i1p1, variable=ta, model=MPI-ESM-LR, time_frequency=mon
Parameters: - model ({'MPI-ESM-LR', 'MPI-ESM-MR'}) – Choose a model like MPI-ESM-LR.
- experiment ({'historical', 'rcp26', 'rcp45', 'rcp85'}) – Choose an experiment like historical.
- ensemble ({'r1i1p1', 'r2i1p1', 'r3i1p1'}) – Choose an ensemble like r1i1p1.
- start_year (integer) – Start year of model data.
- end_year (integer) – End year of model data.
Returns: - namelist (text/plain) – ESMValTool namelist used for processing.
- log (text/plain) – Log File of ESMValTool processing.
- output (application/pdf) – Generated output plot of ESMValTool processing.
References
Perfmetrics
-
class
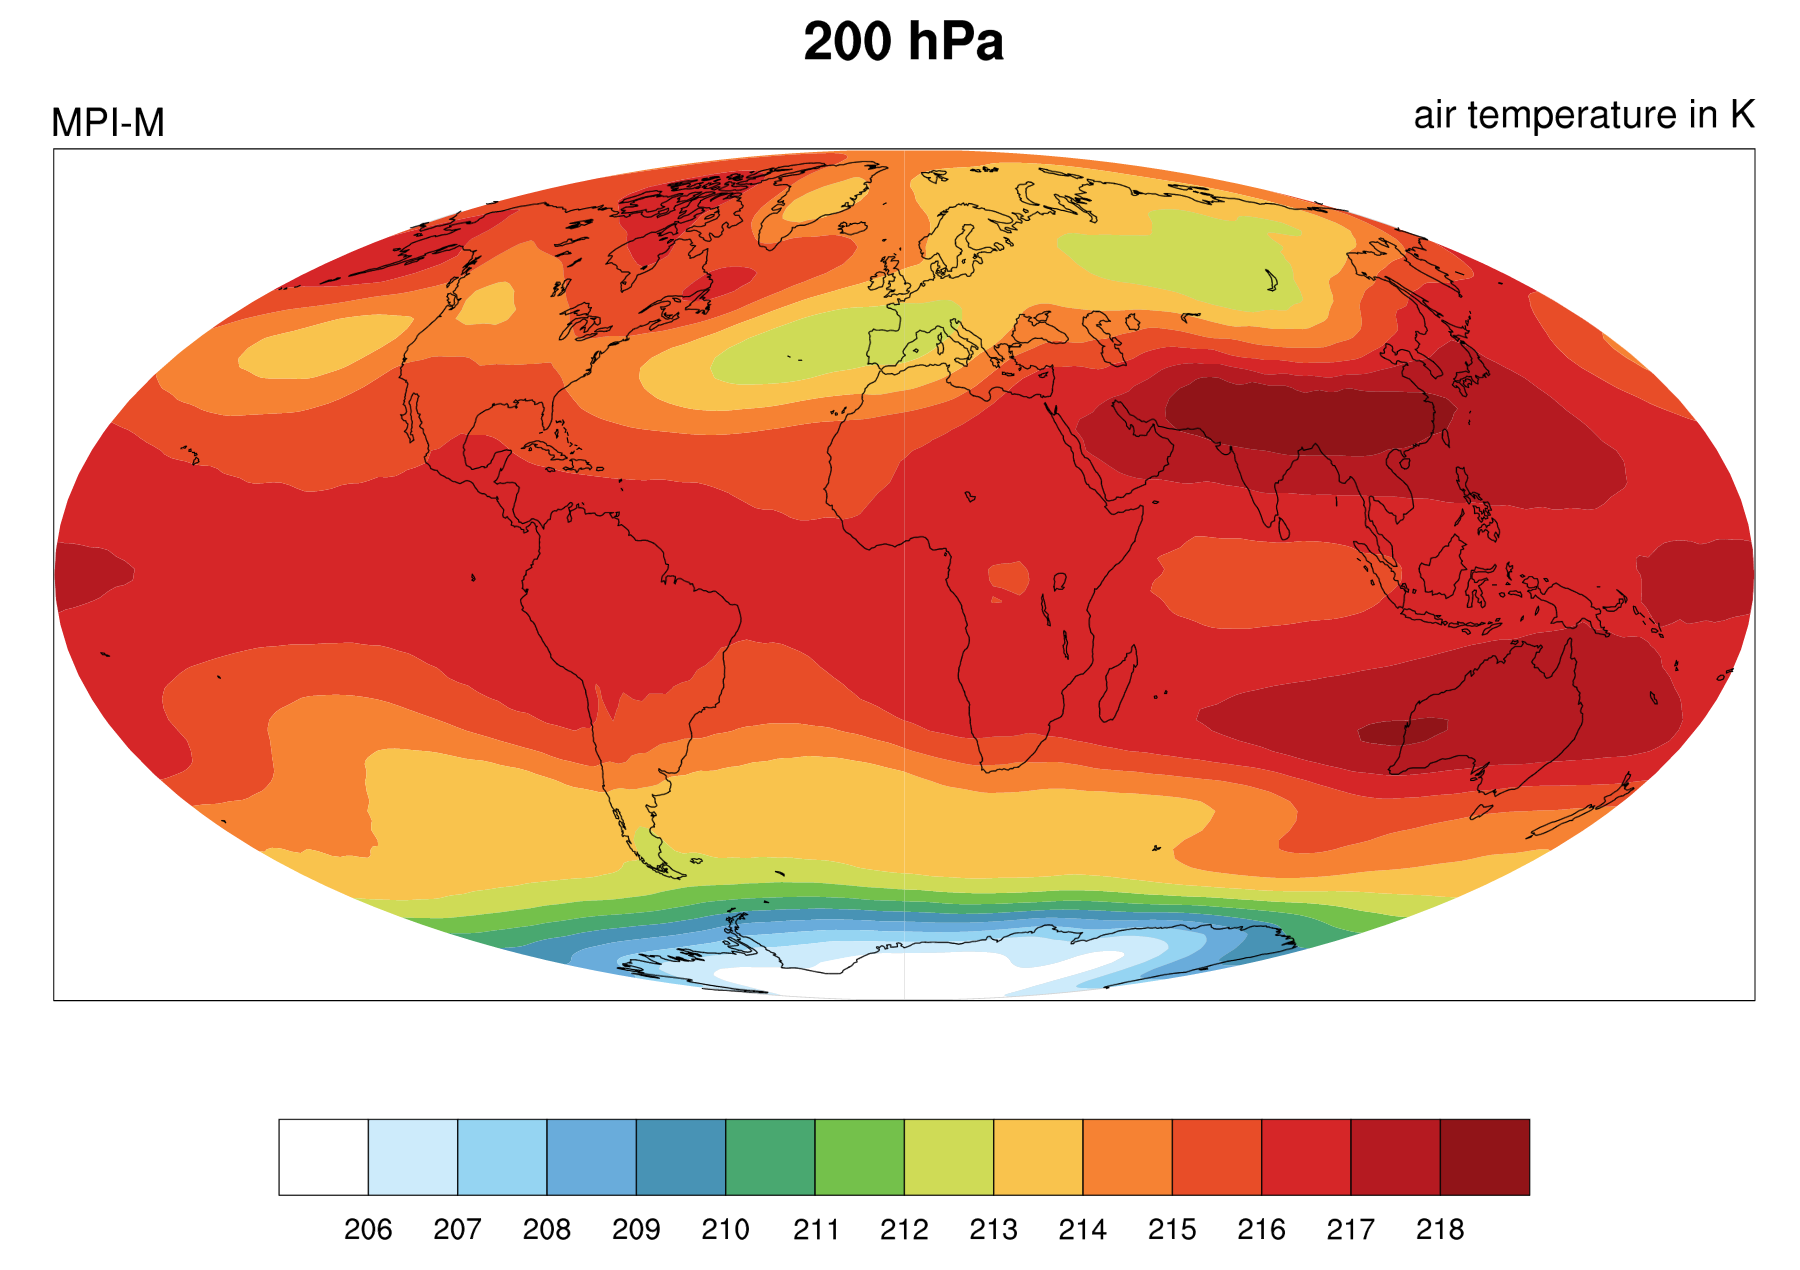
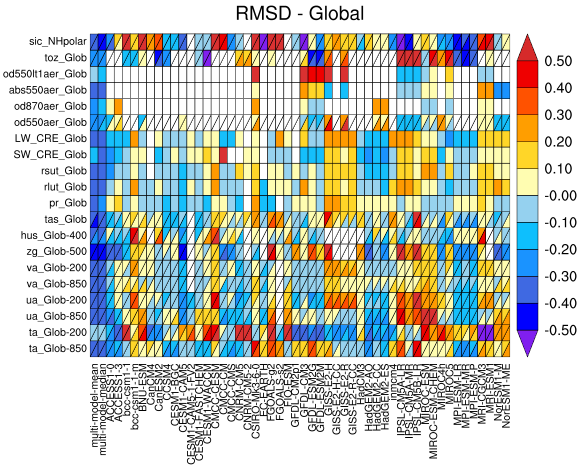
copernicus.processes.wps_perfmetrics.Perfmetrics[source]¶ perfmetrics Performance metrics (v2.0.0)
Creates a performance metrics report comparing models using ESMValTool. The goal is to create a standard namelist for the calculation of performance metrics to quantify the ability of the models to reproduce the climatological mean annual cycle for selected Essential Climate Variables (ECVs) plus some additional corresponding diagnostics and plots to better understand and interpret the results. The namelist can be used to calculate performance metrics at different vertical levels (e.g., 5, 30, 200, 850 hPa as in Gleckler et al., 2008) and in four regions (global, tropics 20N-20S, northern extratropics 20-90N, southern extratropics 20-90S). As an additional reference, we consider the Righi et al. (2015) paper.
Parameters: - model ({'MPI-ESM-LR', 'MPI-ESM-MR'}) – Choose a model like MPI-ESM-LR.
- experiment ({'historical', 'rcp26', 'rcp45', 'rcp85'}) – Choose an experiment like historical.
- ensemble ({'r1i1p1', 'r2i1p1', 'r3i1p1'}) – Choose an ensemble like r1i1p1.
- start_year (integer) – Start year of model data.
- end_year (integer) – End year of model data.
Returns: - namelist (text/plain) – ESMValTool namelist used for processing.
- log (text/plain) – Log File of ESMValTool processing.
- output (application/pdf) – Generated output plot of ESMValTool processing.
References
PyDemo
-
class
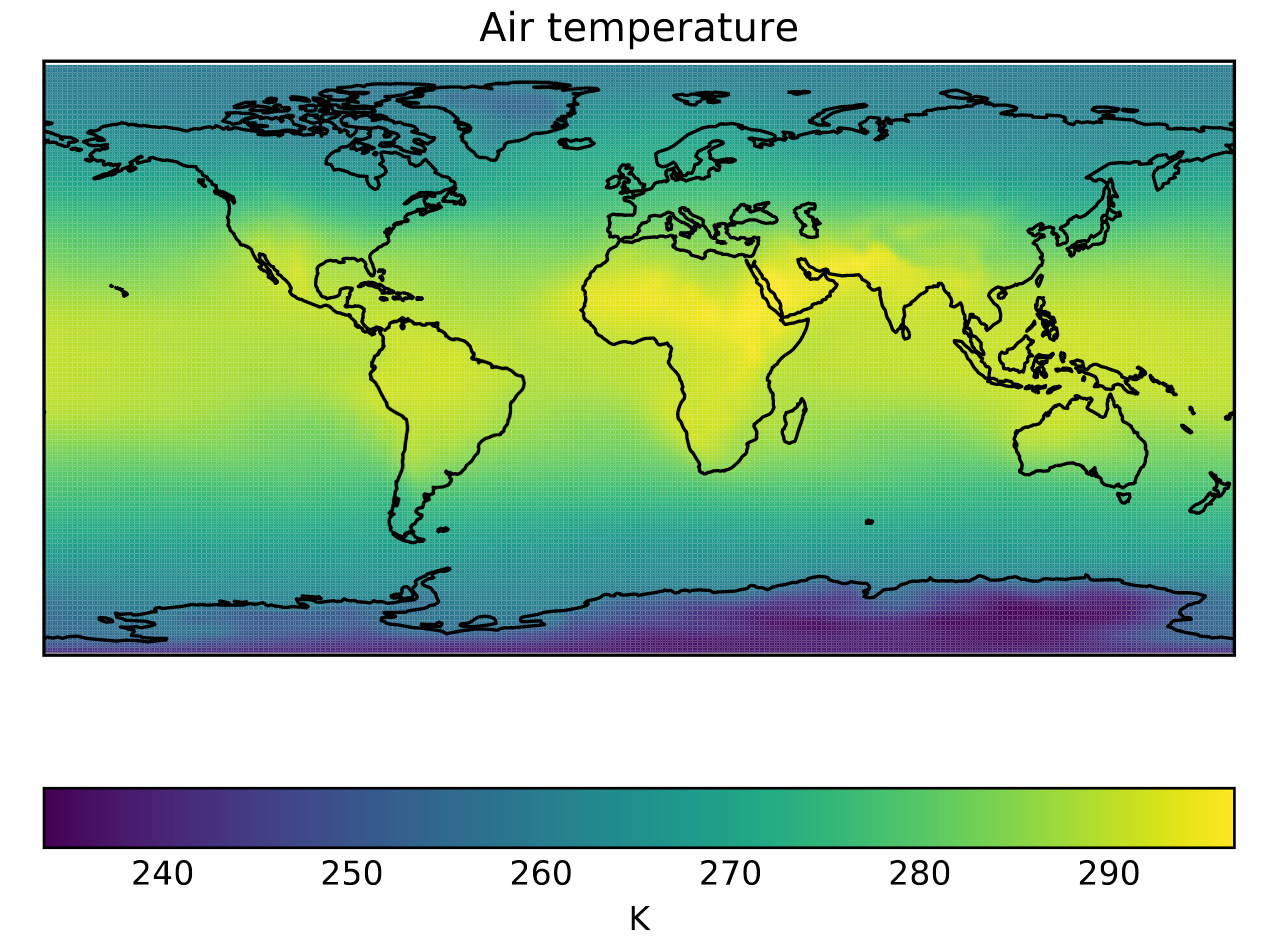
copernicus.processes.wps_pydemo.PyDemo[source]¶ py_demo Python Demo (v2.0.0)
Generates a plot for temperature using ESMValTool. The default run uses the following CMIP5 data: project=CMIP5, experiment=historical, ensemble=r1i1p1, variable=ta, model=MPI-ESM-LR, time_frequency=mon
Parameters: - model ({'MPI-ESM-LR', 'MPI-ESM-MR'}) – Choose a model like MPI-ESM-LR.
- experiment ({'historical', 'rcp26', 'rcp45', 'rcp85'}) – Choose an experiment like historical.
- ensemble ({'r1i1p1', 'r2i1p1', 'r3i1p1'}) – Choose an ensemble like r1i1p1.
- start_year (integer) – Start year of model data.
- end_year (integer) – End year of model data.
Returns: - namelist (text/plain) – ESMValTool namelist used for processing.
- log (text/plain) – Log File of ESMValTool processing.
- output (image/png, application/pdf) – Generated output plot of ESMValTool processing.
References
RainFarm
-
class
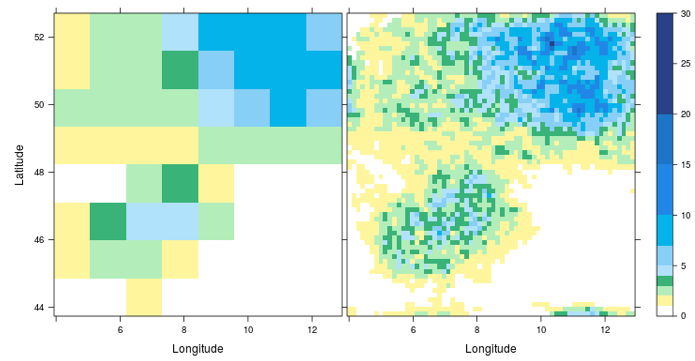
copernicus.processes.wps_rainfarm.RainFarm[source]¶ rainfarm RainFARM stochastic downscaling (v2.0.0)
Tool to perform stochastic precipitation downscaling, generating an ensemble of fine-scale precipitation fields from information simulated by climate models at regional scale.
Parameters: - model ({'ACCESS1-0'}) – Choose a model like MPI-ESM-LR.
- experiment ({'historical'}) – Choose an experiment like historical.
- start_year (integer) – Start year of model data.
- end_year (integer) – End year of model data.
- subset (string) – Choose a geographical subset with a Bounding Box: 4,13,44,53
- regridding (boolean) – Flag for regridding.
- slope (boolean) – Flag for slope.
- num_ens_members (integer) – Choose a number of ensemble members.
- num_subdivs (integer) – Choose a number of subdivisions.
Returns: output – Generated output plot of ESMValTool processing.
Return type: image/png
References
RMSE
-
class
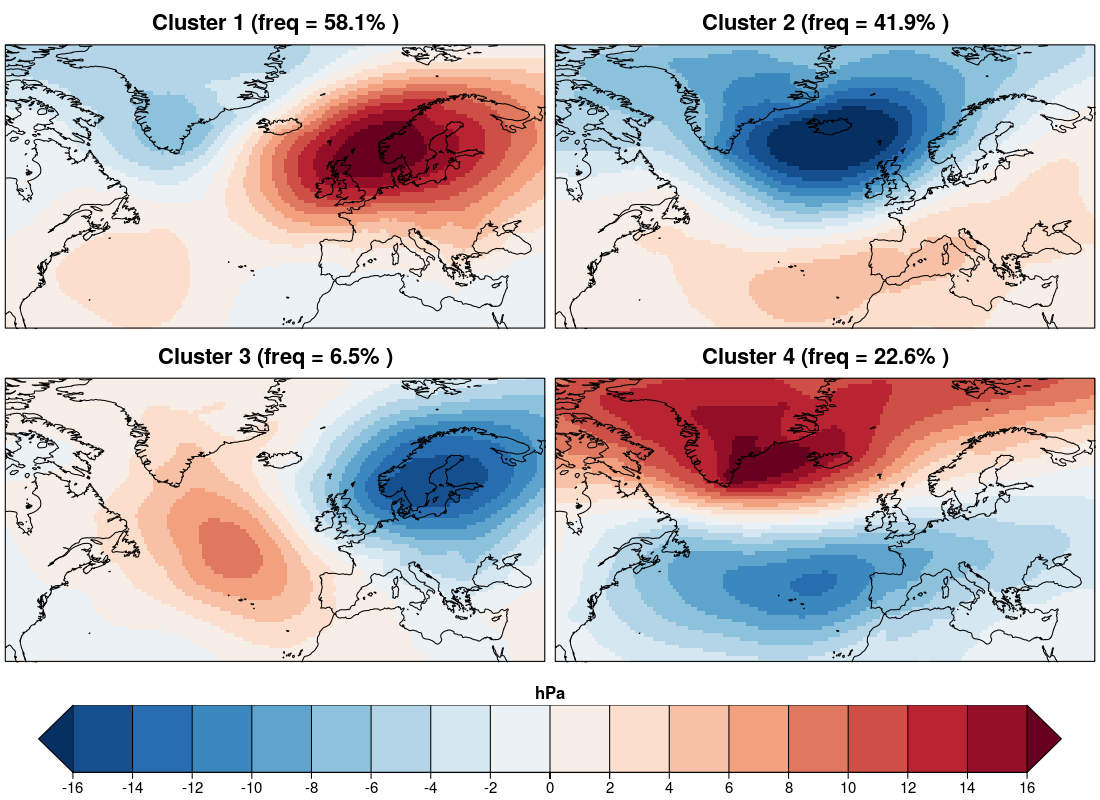
copernicus.processes.wps_rmse.RMSE[source]¶ rmse Modes of variability (v2.0.0)
Tool to compute the RMSE between the observed and modelled patterns of variability obtained through classification and their relative relative bias (percentage) in the frequency of occurrence and the persistence of each mode.
Parameters: - region ({'Arctic'}) – Choose a region like Arctic.
- model ({'NASA'}) – Choose a model like NASA.
- variable ({'sic'}) – Choose a variable like sic.
- ncenters (integer) – Choose a number of centers.
- cluster_method ({'kmeans'}) – Choose a cluster method.
- eofs (boolean) – Choose EOFS.
- detrend (integer) – Choose a detrend.
- experiment ({'historical', 'rcp26', 'rcp85'}) – Choose an experiment.
Returns: output – Generated output plot of ESMValTool processing.
Return type: image/png
References